AdSense reports: dimensions, metrics, saved reports, CSV exports and finding what changed
Key takeaways
- AdSense reports combine breakdowns (dimensions such as date, site, country, platform or ad unit) with metrics (values such as page views, impressions, clicks and estimated earnings).
- A saved report keeps the date range and settings you customized so you can reopen it later.
- The AdSense Management API can generate reports as JSON or CSV; CSV reports default to and allow up to 1,000,000 rows.
- Google notes that earnings up to yesterday are accurate, while more recent earnings are estimated because of possible spam or exchange rate fluctuations.
- To find what changed, split page RPM into traffic, impressions per page view and impression RPM, then drill down by breakdown.
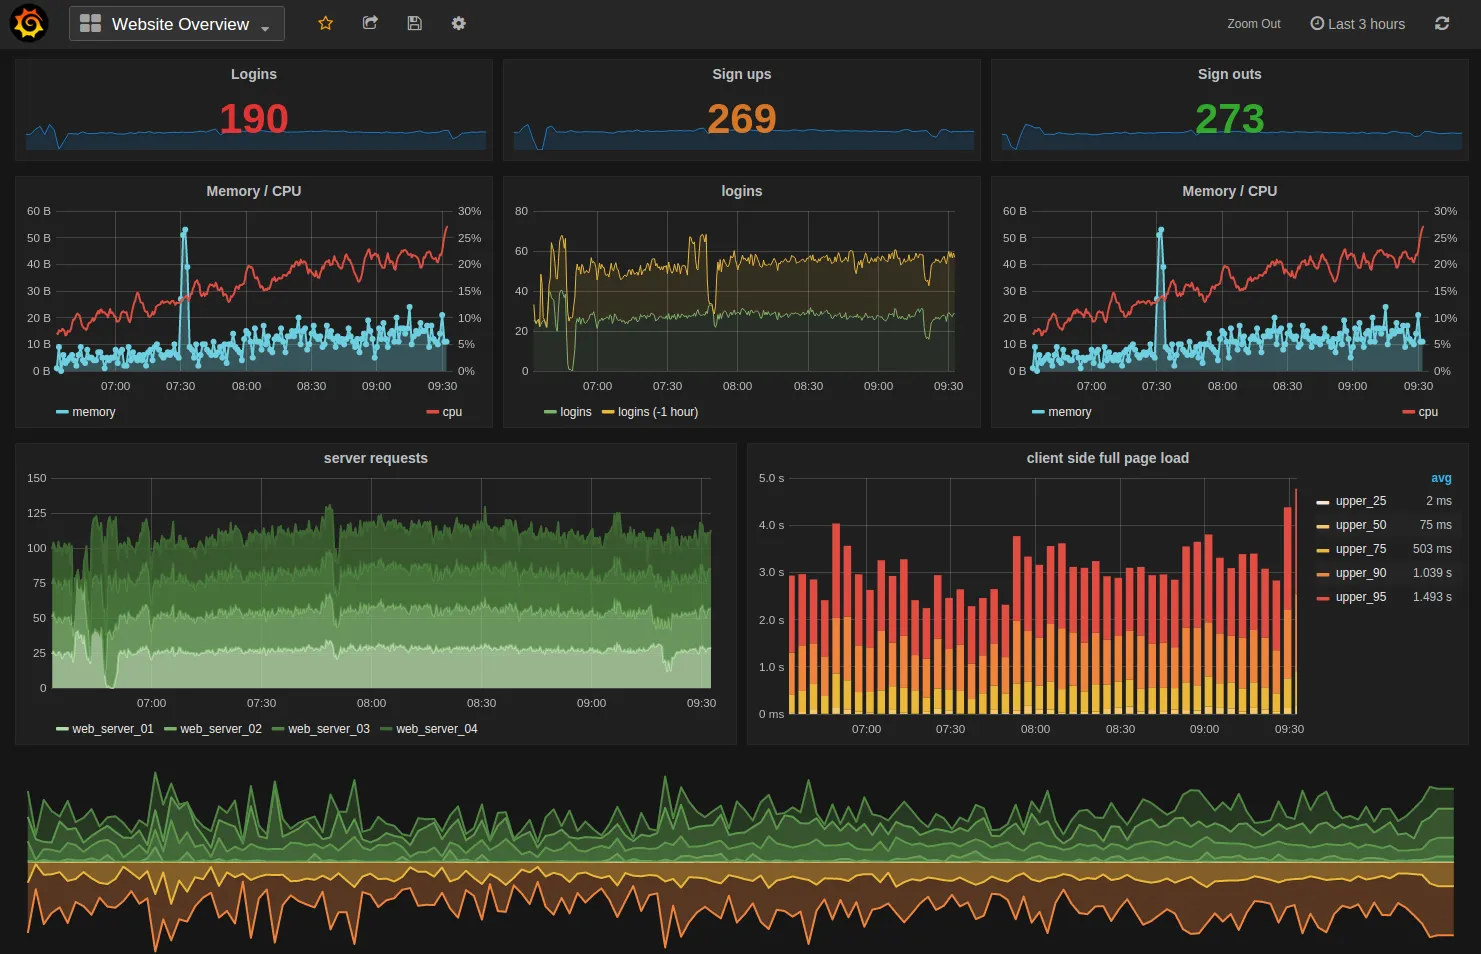
AdSense reports are a table of breakdowns (dimensions such as date, site, country, platform or ad unit) and metrics (page views, impressions, clicks, estimated earnings, RPM). You pick a date range, a breakdown and the metrics, then save the configuration as a saved report. For bulk work, the AdSense Management API exports the same data as CSV, up to 1,000,000 rows per report.
What are metrics and breakdowns?
Google’s help center defines metrics as “the values that you’re measuring. For example, you can measure your account performance by looking at your earnings, number of clicks, number of page views, and so on.” Breakdowns are the dimension you group rows by.
The most complete official list of both is the AdSense Management API reference, which mirrors what the reports can show. The Dimension reference and Metric reference are summarised below.
Breakdowns you will use most
| Breakdown | What it groups by (official description, shortened) | Typical question |
|---|---|---|
| Date, week, month | Calendar periods | When did it change? |
| Site (owned site domain) | Domain name of a verified site | Which site? |
| Page URL | URL of the page where the ad was served (may be canonicalized) | Which pages earn? |
| URL channel, custom channel | Your own groupings of URLs or ad units | Which section or template? |
| Ad unit | Ad unit within which an ad was served | Which slot? |
| Ad format | How the ad is shown, such as “In-page”, “Anchor”, “Vignette” | Which Auto ads format? |
| Country | Region of the user viewing the ad | Which markets? |
| Platform | Platform type, such as “High-end mobile devices”, “Desktop” | Which devices? |
| Bid type | “CPC bids”, “CPM bids” for a served ad | Clicks or impressions? |
| Buyer network | Ad network that returned the winning ads | Who is buying? |
| Targeting type | “Contextual”, “Personalized”, “Run of Network” | Effect of consent and personalization |
| Traffic source | Such as “Google”, “Bing”, “Facebook”, “Other” | Which referrers monetize? |
| Product | Such as “AdSense for Content”, “AdSense for Search” | Content vs search revenue |
Metrics you will use most
| Metric | Official definition, shortened | Formula |
|---|---|---|
| Page views | Number of page views | Count |
| Ad requests | Ad units that requested ads (or search queries) | Count |
| Matched ad requests | Requests that returned at least one ad | Count |
| Impressions | Ad requests where at least one ad was downloaded and began to load | Count |
| Clicks | Clicks on a standard content ad | Count |
| Estimated earnings | Publisher earnings; recent days are estimates | Currency |
| Page RPM | Revenue per thousand page views | Earnings / page views x 1,000 |
| Impression RPM | Revenue per thousand impressions | Earnings / impressions x 1,000 |
| CPC | Earnings per click | Earnings / clicks |
| Impression CTR | Share of impressions resulting in a click | Clicks / impressions |
| Coverage | Ratio of requested ad units or queries to those returned | Matched / requests |
| Active View viewable | Share of measurable impressions that were viewable | Viewable / measurable |
For the RPM family, see RPM vs CPM vs eCPM and page RPM vs impression RPM.
How do I build and save a custom report?
- Open Reports in your AdSense account.
- Choose a date range. Avoid ending on today: recent earnings are estimates.
- Choose a breakdown (for example country). Add a second breakdown if you need a cross-tab (for example country by platform).
- Select the metrics. A good default set: page views, impressions, clicks, estimated earnings, page RPM, impression RPM.
- Add filters if you only want one site, one country or one ad unit.
- Save it. Google’s saved reports page defines a saved report as “a report with specific settings that you’ve customized and saved to use in the future,” including the date range and settings.
Some advanced metrics are only offered in a specific metric family tab. For example, Google notes that ad RPM is only available under the “Advanced” tab.
How do I export reports to CSV?
In the web interface you can download a report table. For repeatable exports, the AdSense Management API v2 has two methods:
| Method | Output | Default and maximum rows |
|---|---|---|
accounts.reports.generate |
JSON (ReportResult) |
100,000 |
accounts.reports.generateCsv |
CSV | 1,000,000 |
A request using the generateCsv method (OAuth scope https://www.googleapis.com/auth/adsense.readonly is enough for reading):
GET https://adsense.googleapis.com/v2/accounts/pub-0000000000000000/reports:generateCsv
    ?dateRange=LAST_30_DAYS
    &dimensions=DATE
    &dimensions=COUNTRY_CODE
    &metrics=PAGE_VIEWS
    &metrics=IMPRESSIONS
    &metrics=ESTIMATED_EARNINGS
    &metrics=PAGE_VIEWS_RPM
    &orderBy=-ESTIMATED_EARNINGS
Notes from the reference pages:
- Account names use the format
accounts/pub-[0-9]+. - Valid
dateRangevalues includeTODAY,YESTERDAY,MONTH_TO_DATE,YEAR_TO_DATE,LAST_7_DAYSandLAST_30_DAYS(both excluding the current day), andCUSTOMwithstartDateandendDate, which is the default if no range is given (ReportingDateRange). orderBysorts ascending with+or no prefix, descending with-.currencyCode(ISO-4217) overrides the account currency;reportingTimeZonedefaults to the account time zone.- Some metrics, such as web search result pages, only work in the Google time zone.
For free, scriptable analysis of your exports alongside open data, see the data tools section.
How do I find what changed?
When earnings move, work from the top down. Each step halves the search space.
- Pick comparable periods. Same weekdays, same length, and ideally the same period last year to remove seasonality (AdSense seasonality).
- Decompose page RPM. Page RPM = impression RPM x impressions per page view. Check which of page views, impressions per page view and impression RPM moved.
- Drill down by the most likely breakdown:
| What moved | First breakdowns to check | Typical causes |
|---|---|---|
| Page views | Site, page URL, traffic source | Search ranking change, lost referral, tracking change |
| Impressions per page view | Ad unit, ad format, platform | Code removed, template change, consent message, Auto ads settings |
| Coverage (matched / requests) | Ad unit, country | Fewer ads available, blocking controls |
| Impression RPM | Country, platform, bid type, targeting type | Season, demand, country mix, personalization share |
| CTR | Ad unit, platform | Layout change; or a sudden spike that needs investigation |
- Check the date breakdown for a step change on a specific day and match it to anything you deployed.
- Check account messages and the Policy center for restrictions that limit ad serving. See policy center explained.
Watch for traffic quality signals
A sudden CTR jump with no layout change, or a surge from one country or traffic source, deserves attention, not celebration. It can indicate invalid traffic, which is removed from finalized earnings. See invalid traffic explained.
Common mistakes
- Comparing partial days. Today’s figures are estimates.
- Averaging RPMs across rows. Recompute from totals: total earnings / total page views x 1,000.
- Sorting by RPM. Low-volume rows top the list; sort by earnings.
- Reading “Country” as your location. It is the viewer’s region.
- Mixing currencies. Exports use the account currency unless you set
currencyCode.
To see AdSense revenue next to user behaviour (sessions, landing pages, engagement), link Google Analytics 4: linking AdSense and Google Analytics.
Frequently asked questions
What is the difference between a dimension and a metric in AdSense reports?
A dimension (called a breakdown in the AdSense interface) is how rows are grouped, such as date, site, country, platform or ad unit. A metric is the value measured for each row, such as page views, impressions, clicks, estimated earnings or page RPM. Google's help center describes metrics as the values you are measuring for your account performance.
How do I export AdSense data to CSV?
Reports in the AdSense interface can be downloaded, and the AdSense Management API has a dedicated accounts.reports.generateCsv method that returns a CSV formatted ad hoc report. Through the API, CSV reports default to and are capped at 1,000,000 rows, while JSON reports from accounts.reports.generate default to and are capped at 100,000 rows.
Why do today's numbers change later?
The AdSense Management API documentation explains that earnings up to yesterday are accurate, while more recent earnings are estimated due to the possibility of spam or exchange rate fluctuations. Finalized monthly earnings can also be lower than estimates after invalid traffic is removed. Avoid drawing conclusions from the current day.
Can I see AdSense earnings per page URL?
Yes. The reporting dimensions include the page URL on which the ad was served. Google notes the URL may be a canonicalized version of the one used in the original request, and lists caveats for this breakdown. URL channels, which group URLs by pattern, are another way to report by section.
Sources
- Metrics · Google AdSense Help
- Saved reports · Google AdSense Help
- Metric (AdSense Management API reference) · Google for Developers
- Dimension (AdSense Management API reference) · Google for Developers
- Method: accounts.reports.generateCsv · Google for Developers
- ReportingDateRange · Google for Developers
Related guides
- Page RPM vs impression RPM: why they differ and which one to track
Why page RPM and impression RPM move differently, the formula that links them, and how to use both to diagnose AdSense revenue changes correctly.
- Why AdSense RPM differs by country and device, and how to read the country and platform reports
Why the same page earns different RPM in different countries and on mobile vs desktop: advertiser demand, auction competition, ad load, and how to read the reports.
- Linking AdSense and Google Analytics 4: what data you get, how to set it up, and its limits
How to link a Google Analytics 4 property with AdSense: required access, the exact steps, which ad metrics appear in GA4, and why the numbers never match exactly.
- AdSense experiments: how they run, what you can test, and how to read the results
How AdSense experiments compare an original and a variation, what you can test, how Auto optimize works, and how to read results without fooling yourself.