Open data on internet users and mobile use by country: World Bank, ITU and Eurostat
Key takeaways
- The World Bank indicator IT.NET.USER.ZS gives the share of individuals using the Internet by country, and its metadata names ITU's World Telecommunication/ICT Indicators Database as the source.
- ITU defines Internet users as individuals who have used the Internet from any location in the last three months, through any device.
- Eurostat's ICT usage survey covers individuals aged 16 to 74 in EU countries, with data generally referring to the first quarter of each year.
- Mobile cellular subscriptions per 100 people (IT.CEL.SETS.P2) often exceed 100 because one person can hold several SIM cards, so it is not a count of mobile users.
- ITU's Facts and Figures 2025 estimates that 2.2 billion people remain offline.
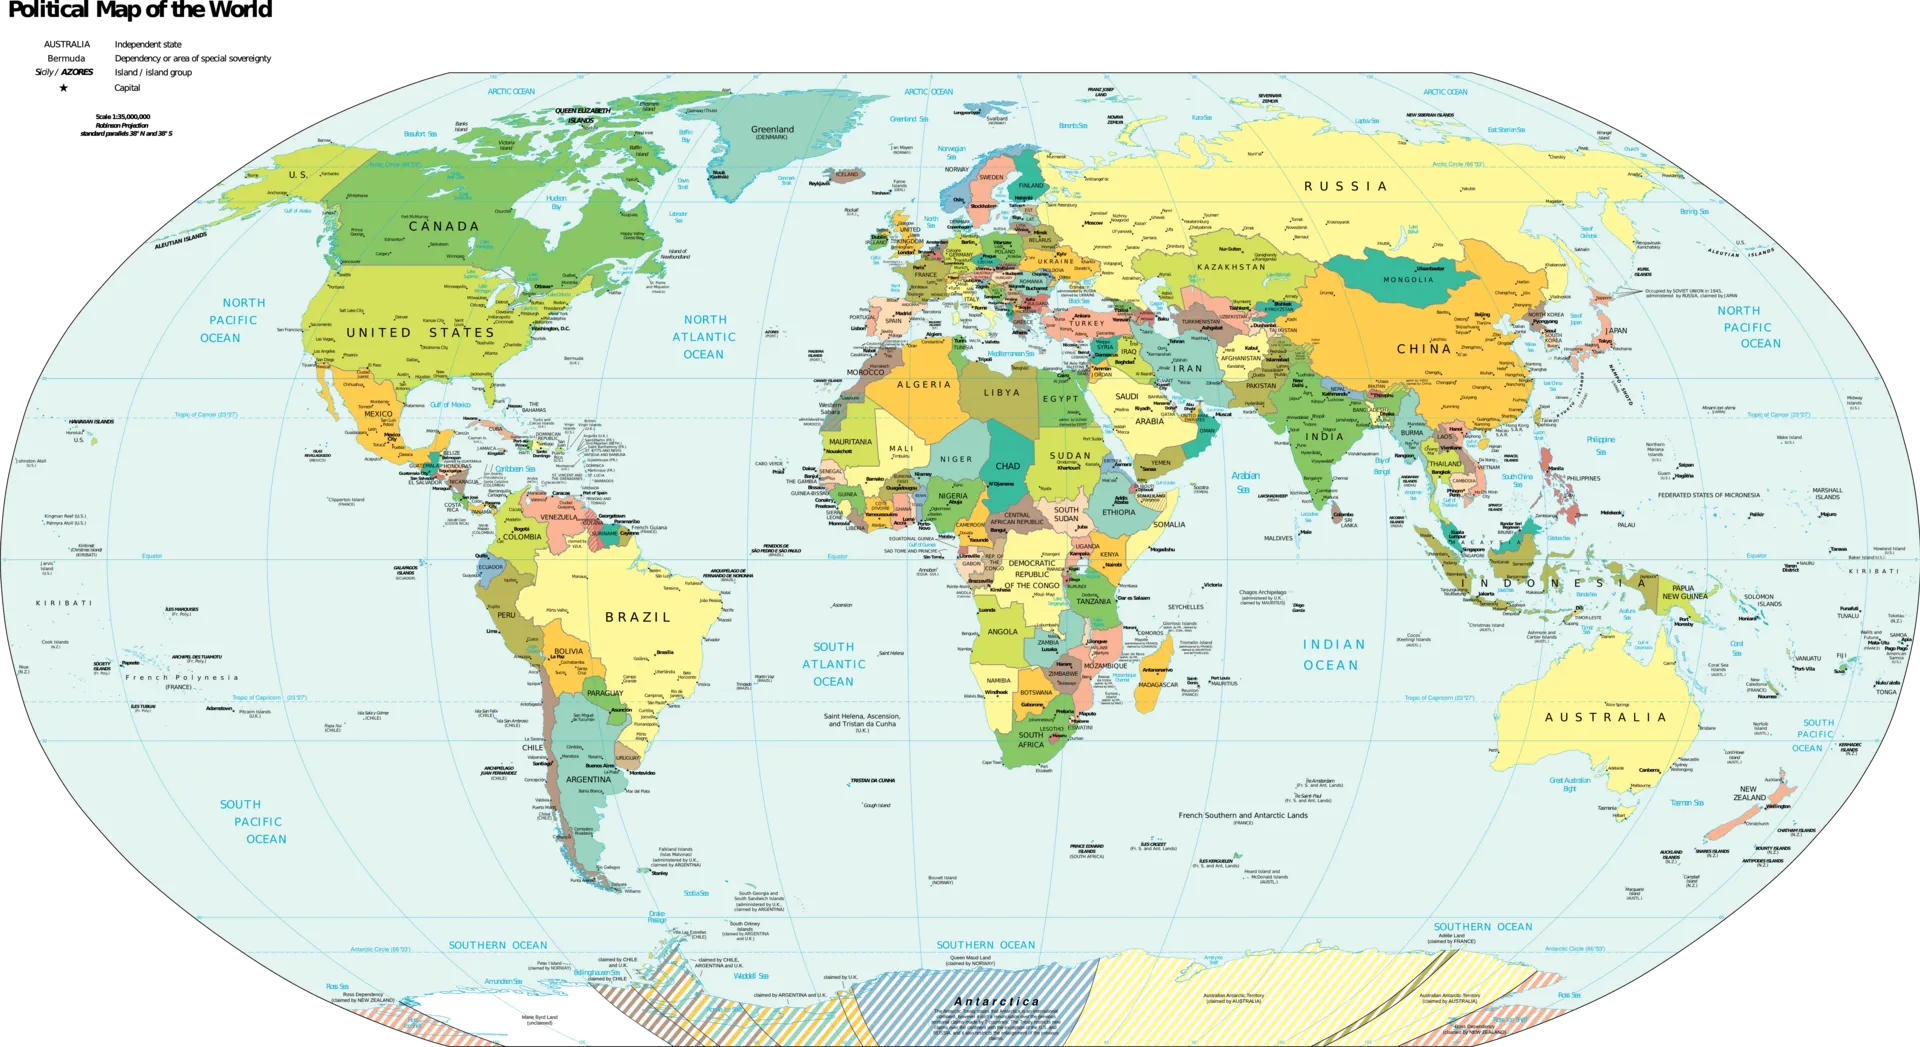
If you are deciding which country or language to write for, start with free official statistics: the World Bank API (indicator IT.NET.USER.ZS, sourced from ITU) for the share of people online in every country, ITU for global estimates, and Eurostat for detailed EU survey data. All three can be queried in a minute, and the numbers below come from real calls made on November 18, 2026.
What do these datasets actually measure?
| Source | Indicator | Definition | Coverage |
|---|---|---|---|
| World Bank (from ITU) | IT.NET.USER.ZS | “Individuals using the Internet (% of population)”: used the Internet from any location in the last 3 months | almost every country, yearly |
| World Bank (from ITU) | IT.CEL.SETS.P2 | Mobile cellular subscriptions per 100 people | almost every country, yearly |
| ITU | Facts and Figures, DataHub | ITU’s own estimates and country series | global, regional, country |
| Eurostat | isoc_ci_ifp_iu | EU ICT household survey: internet use by individuals | EU countries (see the metadata for full coverage), ages 16 to 74 |
The World Bank API metadata for IT.NET.USER.ZS gives the source organisation as the “World Telecommunication/ICT Indicators Database, International Telecommunication Union (ITU)”, and describes the Internet as usable “via a computer, mobile phone, personal digital assistant, games machine, digital TV etc.” So when you use the World Bank number, you are using ITU data in a more convenient wrapper.
How do I query the World Bank API?
No key is needed. Ask for one or more countries (ISO codes separated by semicolons), one indicator and mrnev=1 for the most recent non-empty value per country:
curl -s "https://api.worldbank.org/v2/country/FR;US;IN;NG;BR;DE/indicator/IT.NET.USER.ZS?format=json&mrnev=1"The response is a two-element JSON array: paging metadata (including lastupdated), then the data rows. On 2026-11-18 the metadata showed "lastupdated": "2026-11-11" and these values:
| Country | Latest year | Individuals using the Internet (% of population) |
|---|---|---|
| United States | 2024 | 94.7 |
| Germany | 2024 | 93.5 |
| France | 2024 | 88.7 |
| Brazil | 2024 | 84.5 |
| India | 2025 | 70 |
| Nigeria | 2024 | 41.2 |
Notice that India’s latest value is for a different year than the others and is a round number. Mixed years are normal in this dataset; always display the year next to the value.
The same call with IT.CEL.SETS.P2 returned mobile subscriptions per 100 people of 129.2 for Germany (2024), 116.7 for France (2023), 113.2 for the United States (2024), 101.9 for Brazil (2024), 79.4 for India (2024) and 70.8 for Nigeria (2024). Germany above 129 shows why this is a market-saturation measure, not a count of people.
Indicator metadata (name, definition, source) comes from:
curl -s "https://api.worldbank.org/v2/indicator/IT.NET.USER.ZS?format=json"Licence
The World Bank Data Catalog licensing page says datasets produced by the World Bank are under Creative Commons Attribution 4.0 by default, while some third-party data carries other terms (ODbL, licences specified externally, or custom licences). Because this indicator originates at ITU, check its metadata before redistributing large extracts, and always credit “World Bank, from ITU” with the year.
What does ITU add?
ITU’s statistics page describes ITU as “the official source for global ICT statistics”, offers a downloadable Excel time series for the world and regions, and points to ITU DataHub for more recent data.
ITU’s Facts and Figures 2025 estimates that almost three-quarters of the world’s population are now online, that 2.2 billion people remain offline (most of them in low and middle income countries), and that 5G reaches more than half of the global population.
When this guide was written, ITU DataHub (datahub.itu.int) refused automated requests from our research environment, so no DataHub values are reproduced here. Open it in a browser for country series and download options, and read its terms before reuse; this guide does not state them.
How do I query Eurostat?
Eurostat’s ICT usage survey is the most detailed source for EU markets. Its metadata page describes the “EU survey on the use of Information and Communication Technologies (ICT) in households and by individuals”: yearly, covering individuals aged 16 to 74, with data generally referring to the first quarter of the reference year.
The dissemination API returns JSON-stat. This call asks for the share of individuals who used the Internet in the last 12 months, latest year only:
curl -s "https://ec.europa.eu/eurostat/api/dissemination/statistics/1.0/data/isoc_ci_ifp_iu?format=JSON&lang=EN&geo=EU27_2020&geo=DE&geo=FR&geo=RO&indic_is=I_ILT12&ind_type=IND_TOTAL&unit=PC_IND&lastTimePeriod=1"On 2026-11-18 the response (dataset updated 2026-04-17) gave these 2025 values for “Last internet use: in the last 12 months”, percentage of individuals:
| Area | 2025 |
|---|---|
| European Union (27) | 94.53 |
| Germany | 95.54 |
| France | 95.69 |
| Romania | 94.83 |
In JSON-stat, the value object is keyed by position, and dimension.geo.category.index tells you which position belongs to which country. Read the index rather than assuming the order of your request.
These figures are not comparable with the World Bank’s: different age range (16 to 74 versus the whole population), different time window (12 months versus 3 months) and different survey design.
A small script to build a market shortlist
Multiplying population (World Bank indicator SP.POP.TOTL) by the share of people online gives a rough count of people reachable online per country. This Node.js script (Node 18 or later) does it for a list of countries:
// market-size.mjs: estimated people online = population x share online
const countries = 'FR;BE;CH;CA;SN;CI'; // example: French-speaking markets
const url = (ind) =>
  `https://api.worldbank.org/v2/country/${countries}/indicator/${ind}?format=json&mrnev=1&per_page=100`;

async function getRows(ind) {
  const res = await fetch(url(ind));
  if (!res.ok) throw new Error(`${ind}: HTTP ${res.status}, try again later`);
  const [, rows] = await res.json();
  return rows ?? [];
}

const pop = await getRows('SP.POP.TOTL');
const net = await getRows('IT.NET.USER.ZS');

for (const p of pop) {
  const n = net.find((r) => r.countryiso3code === p.countryiso3code);
  if (!n || n.value == null || p.value == null) continue;
  const millions = ((p.value * n.value) / 100 / 1e6).toFixed(1);
  console.log(`${p.country.value}: ~${millions} M online ` +
    `(population ${p.date}, share ${n.date}: ${n.value.toFixed(1)}%)`);
}
Run on 2026-11-18, it printed (real output):
Belgium: ~11.4 M online (population 2025, share 2024: 95.8%)
Canada: ~39.3 M online (population 2025, share 2024: 94.4%)
Switzerland: ~8.8 M online (population 2025, share 2025: 97.3%)
Cote d'Ivoire: ~13.6 M online (population 2025, share 2024: 41.4%)
France: ~60.9 M online (population 2025, share 2024: 88.7%)
Senegal: ~11.4 M online (population 2025, share 2024: 60.1%)
Two caveats are visible in that output. First, the result counts the whole population, not speakers of your language: Canada’s 39.3 million includes every Canadian online, not only French speakers. Second, population and internet share come from different years. A few minutes earlier the same API returned HTTP 502 errors for every request, which is why the script checks res.ok instead of assuming the body is JSON.
How should a publisher use this data?
- Size the reachable audience first. Population times internet share gives an order of magnitude for a language or country.
- Check whether your format suits the market. In markets where mobile is dominant, layouts, page weight and ad formats must work on phones first (see field Core Web Vitals from CrUX).
- Combine with topic demand. Pageviews in the local Wikipedia edition give a rough idea of interest in your subject in that language (see the Wikimedia Pageviews API guide).
- Validate with your own revenue data. Advertiser demand, not internet penetration, drives what a pageview earns; read why RPM differs by country and device and your account’s Countries report.
- Check regulation. Entering the EEA, the UK or certain US states changes consent requirements; see US state privacy laws and AdSense.
Common mistakes
- Comparing different years side by side without saying so. Show the year for every country.
- Reading subscriptions as users. Values above 100 per 100 people are subscriptions, not people.
- Mixing Eurostat and World Bank figures in one ranking. Different definitions, different results.
- Hard-coding a value in an article. Both APIs are updated; store the query and refresh it, and give readers the date of the data.
- Concluding that a market will pay well because it is large. Open data on connectivity says nothing about advertiser budgets. Google does not publish RPM by country, and no open dataset replaces your own reports.
Frequently asked questions
Which dataset should I use for the share of people online in a country?
For a worldwide comparison, use the World Bank indicator IT.NET.USER.ZS, which republishes ITU figures in a free API with one consistent definition. For EU countries, Eurostat's ICT usage survey adds detail by age, education and activity, but it covers people aged 16 to 74 only. Check the year of each value, because the latest available year differs between countries.
Is the number of mobile subscriptions the same as the number of mobile internet users?
No. IT.CEL.SETS.P2 counts mobile cellular subscriptions per 100 people, and values above 100 are common because people hold several SIMs or devices. It tells you how saturated the mobile market is, not how many people browse on phones. For your own audience, your analytics device report is the reliable source.
Can I republish World Bank data on my site?
The World Bank Data Catalog says datasets produced by the World Bank are licensed under Creative Commons Attribution 4.0 by default, with other licences for some third-party data. IT.NET.USER.ZS is sourced from ITU, so check the indicator's metadata page for its specific terms, and always credit the source and year.
Does a high internet penetration rate mean higher AdSense earnings?
Not directly. Penetration tells you how many people can be reached; what advertisers pay depends on demand in that market and language, which varies widely. Use open data to size a market, then look at the Countries report in your own AdSense account before deciding where to invest in content.
Sources
- Data Access And Licensing - World Bank Data Catalog · World Bank
- Statistics · International Telecommunication Union
- Facts and Figures 2025 · International Telecommunication Union
- ICT usage in households and by individuals (isoc_i) · Eurostat
Related guides
- Why AdSense RPM differs by country and device, and how to read the country and platform reports
Why the same page earns different RPM in different countries and on mobile vs desktop: advertiser demand, auction competition, ad load, and how to read the reports.
- Wikimedia Pageviews API: free, open topic demand data for content planning
Measure topic demand with the free Wikimedia Pageviews API: endpoints, curl examples, real data pulled on 2026-11-18, the User-Agent rule and the traps.
- US state privacy laws and AdSense: opt-outs, restricted data processing and the GPP
What US state privacy laws like the CCPA mean for AdSense: opt-out of sale or sharing, restricted data processing, Google's US states message, GPP and GPC.
- Chrome UX Report (CrUX) for publishers: field Core Web Vitals for any popular site
Get free field Core Web Vitals for your site and competitors from CrUX: API calls, BigQuery SQL, the new ad metrics, and why your origin may return no data.