Chrome UX Report (CrUX) for publishers: field Core Web Vitals for any popular site
Key takeaways
- The Chrome UX Report (CrUX) is Google's public dataset of real-user experience metrics from opted-in Chrome users, published under a Creative Commons Attribution 4.0 licence.
- A page or origin appears in CrUX only if it is publicly discoverable and sufficiently popular; Google does not disclose the popularity threshold.
- The CrUX API returns a 28-day rolling aggregate updated daily around 04:00 UTC and allows 150 queries per minute per Google Cloud project at no charge.
- The BigQuery dataset chrome-ux-report is released monthly, on the second Tuesday of the following month, with ready-made summary tables such as materialized.device_summary.
- Since September 2026 CrUX documents experimental ad metrics (ad count, ad density, ad CPU and ad kilobytes), reported only for sites whose ads.txt lists at least one authorized seller.
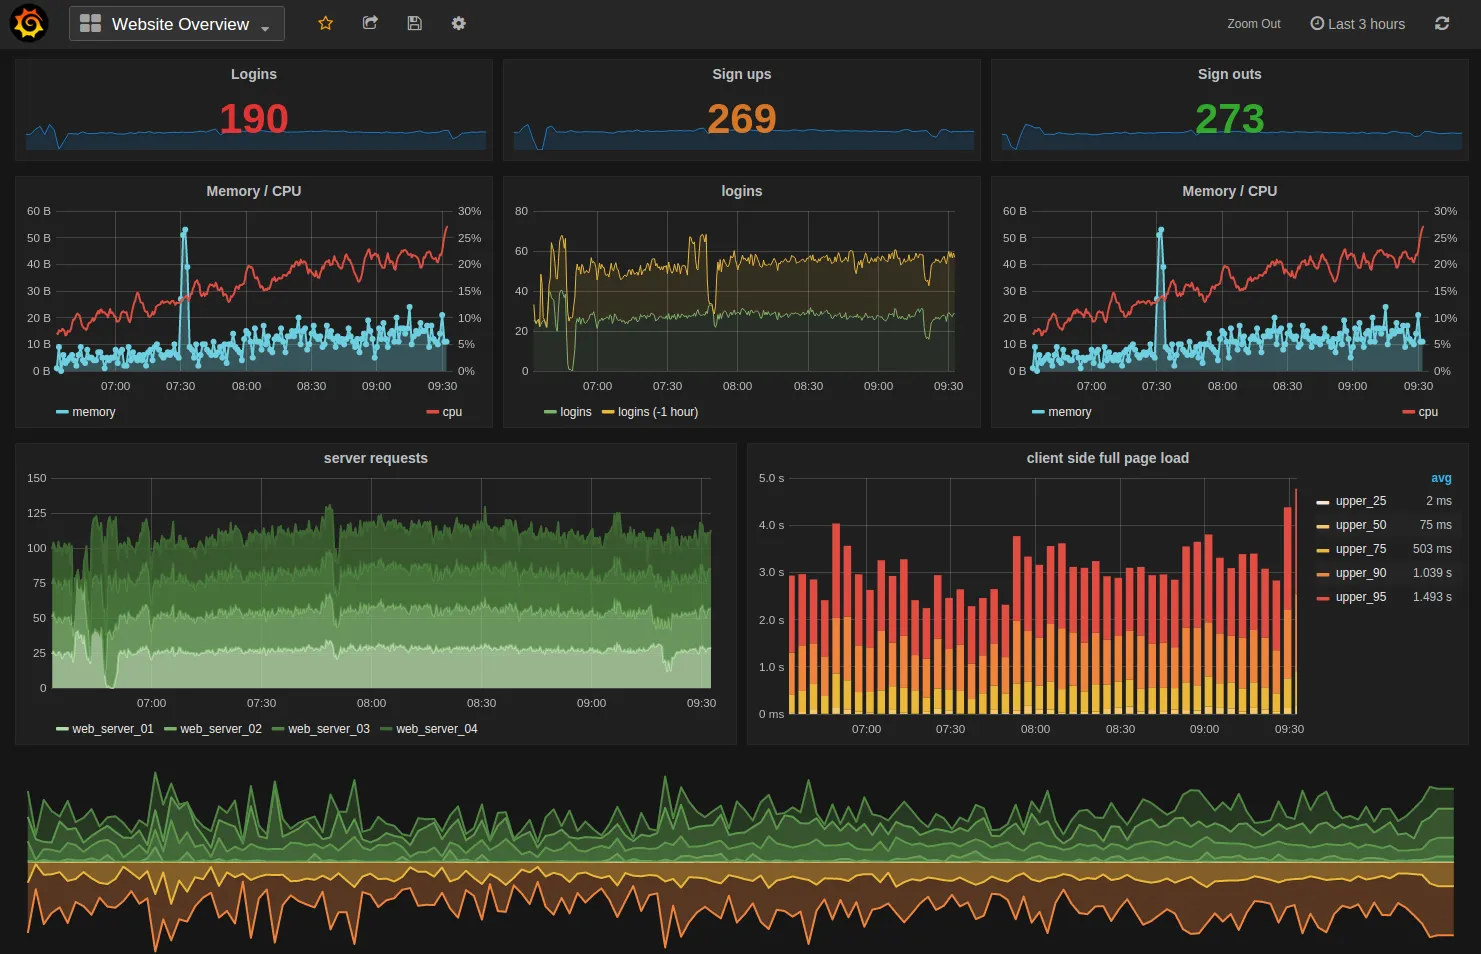
The Chrome UX Report (CrUX) is Google’s free public dataset of how real Chrome users experience popular websites: Largest Contentful Paint, Interaction to Next Paint, Cumulative Layout Shift and more, at the 75th percentile. You can query it for your own origin or any competitor’s through a REST API or BigQuery. For ad-funded sites it is the cheapest way to see whether ads hurt real users.
Who is in CrUX, and who is not?
The CrUX methodology sets two conditions for a page or origin:
- Publicly discoverable. The same indexability rules as search engines: a non-200 status, an
X-Robots-Tag: noindexheader or a robotsnoindexmeta tag disqualifies a page. - Sufficiently popular. Google does not publish the threshold.
Data comes only from Chrome users who have usage statistics reporting enabled, browser history sync turned on and no Sync passphrase, on desktop Chrome (Windows, macOS, ChromeOS, Linux) and Android Chrome (including Custom Tabs and WebAPKs). Chrome on iOS, Android WebView apps and other Chromium browsers such as Microsoft Edge do not contribute.
That matters for publishers: if much of your audience reads you inside a social app’s in-app browser (often a WebView) or on iPhone, CrUX describes only part of it. Your own real-user measurement fills the gap; see measuring Core Web Vitals with web-vitals.
The methodology states that CrUX datasets are licensed under Creative Commons Attribution 4.0 International, so you can publish charts built on them with attribution.
How do I query the CrUX API?
The CrUX API has one endpoint, records:queryRecord, and needs a Google Cloud API key enabled for the “Chrome UX Report API”.
- Create a key (the CrUX docs point to
goo.gle/crux-api-key) and restrict it to the Chrome UX Report API. - Send a POST with either
originorurl, an optionalformFactor(DESKTOP,PHONEorTABLET) and an optionalmetricslist. - Read
record.metrics.<metric>.percentiles.p75and the histogram densities.
curl -s -X POST \
  "https://chromeuxreport.googleapis.com/v1/records:queryRecord?key=$CRUX_API_KEY" \
  -H "Content-Type: application/json" \
  -d '{
    "origin": "https://www.example.com",
    "formFactor": "PHONE",
    "metrics": ["largest_contentful_paint",
                "interaction_to_next_paint",
                "cumulative_layout_shift"]
  }'
The response has this shape (values here are illustrative, not from a real call):
{
  "record": {
    "key": { "formFactor": "PHONE", "origin": "https://www.example.com" },
    "metrics": {
      "largest_contentful_paint": { "percentiles": { "p75": 2810 } },
      "cumulative_layout_shift": { "percentiles": { "p75": "0.12" } }
    },
    "collectionPeriod": {
      "firstDate": { "year": 2026, "month": 10, "day": 18 },
      "lastDate": { "year": 2026, "month": 11, "day": 14 }
    }
  }
}
Operational facts from the documentation:
| Item | Value |
|---|---|
| Aggregation window | 28-day rolling |
| Refresh | daily, around 04:00 UTC, best effort, no SLA |
| Lag | about two days behind the current date |
| Quota | 150 queries per minute per Google Cloud project, free, not purchasable |
| No data | HTTP 404, message “chrome ux report data not found” |
Track trends with the History API
The CrUX History API (records:queryHistoryRecord) returns weekly collection periods: 25 by default, up to 40 with collectionPeriodCount. It is updated each Monday around 04:00 UTC and uses the same key. This is the quickest way to see whether a layout change (for example, adding an in-article unit) moved CLS over the following weeks.
What are the new CrUX ad metrics?
The API now lists four experimental metrics: experimental_ad_count, experimental_ad_density, experimental_ad_cpu (milliseconds) and experimental_ad_kilobytes (KB), each reported at p75 only, and only for pages included in ad metrics. They are marked “n/a” for BigQuery.
The Chrome ad metrics methodology, published September 15, 2026, explains the rules:
- Only sites that list at least one authorized seller in
ads.txtare included. Origins with no ads.txt, or only a placeholder record, are excluded. - An ad counts if at least one of its pixels is in the viewport; overlapping ads each count.
- The viewport is sampled once per second, and collection pauses while the tab is in the background.
- Ads hidden with
display: noneare excluded from count and density, but their CPU and network cost still counts. - Chrome DevTools has an Ads panel that shows these metrics locally for any page you inspect.
For AdSense publishers this is the first public, field-based view of ad load. Two practical uses: compare your ad density with sites in your niche before adding units, and check that ad CPU time did not spike after enabling a new format. A correct ads.txt is the entry ticket; see ads.txt syntax.
curl -s -X POST \
  "https://chromeuxreport.googleapis.com/v1/records:queryRecord?key=$CRUX_API_KEY" \
  -H "Content-Type: application/json" \
  -d '{"origin": "https://www.example.com", "formFactor": "PHONE",
       "metrics": ["experimental_ad_count", "experimental_ad_density"]}'
If the fields are missing from the response, CrUX has no ad data for that origin.
How do I use CrUX in BigQuery?
The CrUX BigQuery documentation describes the project chrome-ux-report, released on the second Tuesday of the following month:
| Dataset / table | Contents |
|---|---|
all.YYYYMM |
raw monthly histograms for every origin |
country_CC.YYYYMM |
the same, per country |
materialized.metrics_summary |
one row per origin and month with p75 values and good/needs improvement/poor fractions |
materialized.device_summary |
the same, split by device |
materialized.country_summary |
split by country and device |
The summary tables are small, which keeps you inside the BigQuery free tier. This query is adapted from the official samples in the GoogleChrome/CrUX repository (sql/mastering-crux/03-device-cwv.sql):
-- Monthly Core Web Vitals by device for one origin
SELECT
  yyyymm,
  device,
  p75_lcp,
  fast_lcp / (fast_lcp + avg_lcp + slow_lcp) AS pct_good_lcp,
  p75_inp,
  fast_inp / (fast_inp + avg_inp + slow_inp) AS pct_good_inp,
  p75_cls,
  small_cls / (small_cls + medium_cls + large_cls) AS pct_good_cls
FROM `chrome-ux-report.materialized.device_summary`
WHERE date >= '2025-11-01'
  AND origin = 'https://www.example.com'
  AND device IN ('desktop', 'phone')
ORDER BY yyyymm DESC, device;
The repository comment notes that metrics_summary is partitioned by date in YYYY-MM-01 form, so the date filter is what keeps the scan small.
Compare yourself with competitors
Replace the single origin with a list: origin IN ('https://a.example', 'https://b.example'). Put sites with similar audiences side by side (same country mix, same mobile share). Comparing a recipe blog with a news site tells you little, because LCP depends heavily on page type.
How should a publisher read the numbers?
- Use the 75th percentile. The thresholds used in the web-vitals library are 2,500 ms / 4,000 ms for LCP, 200 ms / 500 ms for INP and 0.1 / 0.25 for CLS (good / poor boundaries).
- Split by device. Ad layouts differ between phones and desktops, and an origin-wide number can hide a poor phone CLS.
- Watch the window. A fix you shipped yesterday will take up to 28 days to show fully in the API, and a month or more in BigQuery.
- CrUX includes iframes, your scripts do not. The web-vitals documentation notes that its APIs cannot see inside iframes, while CrUX can. Ads render in iframes, so CrUX may report layout shifts your own monitoring misses.
A simple monthly routine works for most ad-supported sites:
- Query the API for your origin with
formFactorset toPHONE, thenDESKTOP, and note the p75 for LCP, INP and CLS. - Pull the History API series for the same origin and check whether the last few collection periods moved after an ad layout change.
- Query your three most important templates as individual URLs, if they have enough traffic to be included.
- Write the values and the date in a simple log, next to the changes you made. Without that log, a slow drift is impossible to explain later.
For fixes, see ads and Core Web Vitals and reserving space to prevent CLS.
Common mistakes
- Querying
www.example.comwhen the canonical origin isexample.com, then concluding the site has no data. - Putting the API key in client-side code on a public page. Call the API from a server or a script.
- Treating a missing ad metric as “no ads”. It means no data, often because ads.txt has no authorized seller.
- Comparing a lab Lighthouse score with CrUX p75 values. They measure different things; see Lighthouse CI on ad-heavy pages for the lab side.
Open-source tools mentioned
| Tool | Licence |
|---|---|
| CrUX (sample queries and tooling) | Apache-2.0 |
Frequently asked questions
Why does the CrUX API say "chrome ux report data not found" for my site?
The API returns a 404 with that message when it has no data for the origin or URL. Common causes are a mismatch in the origin you typed (http instead of https, an extra or missing www), a page that is not publicly discoverable (noindex or non-200 status), or too few eligible Chrome users. Try the origin instead of the URL, and the exact canonical hostname.
Is CrUX the same data as Search Console's Core Web Vitals report?
Both come from Chrome field data, and the web-vitals library documentation says it measures metrics the same way they are reported to CrUX, PageSpeed Insights and Search Console. The tools aggregate differently (by page, URL group or origin, and over different windows), so numbers rarely match exactly. Use CrUX when you need raw p75 values or competitor data.
Can I see a competitor's ad density in CrUX?
Only if CrUX reports ad metrics for that site. The Chrome ad metrics methodology says only sites listing at least one authorized seller in ads.txt are included, and the API documents the four experimental ad metrics as p75 values for pages included in ad metrics. They are not available in the BigQuery tables. A missing field means no data, not zero ads.
Do I need to pay to use CrUX?
The API is free within its quota of 150 queries per minute per Google Cloud project, and that quota cannot be increased by paying. BigQuery queries are billed by bytes processed after the monthly free tier, so use the small materialized summary tables and filter on date and origin to stay within it.
Sources
- CrUX methodology · Chrome for Developers
- CrUX API · Chrome for Developers
- CrUX History API · Chrome for Developers
- CrUX on BigQuery · Chrome for Developers
- Chrome ad metrics methodology · Chrome for Developers
Related guides
- Measure real-user Core Web Vitals on ad pages with the open-source web-vitals library
Measure LCP, INP and CLS from real visitors with Google's open-source web-vitals library, find which ad slot causes shifts, and store the data yourself.
- AdSense and Core Web Vitals: measuring the real impact of ads on LCP, INP and CLS
How AdSense ads affect LCP, INP and CLS, why field data and your own RUM disagree on pages with ad iframes, and what to change first to keep pages fast.
- Lighthouse and Lighthouse CI on ad-heavy pages: setup, budgets and measuring third-party impact
Run Lighthouse and Lighthouse CI on pages with AdSense: a tested config, third-party budgets, an ads-on vs ads-off comparison and how to read the results.
- HTTP Archive and the Web Almanac: open data on ad scripts, ads.txt and page weight
Use HTTP Archive and the Web Almanac to measure ads.txt adoption, ad tech usage and third-party weight across millions of sites, with SQL you can adapt.